Apart from saving lives, civilian drones are becoming a good business. By 2020, the market will be worth $100bn in areas such as surveying, security and delivery. Discover what our robot, Athena, thinks the varied future of drones could be, act accordingly or click any link to read the evidence gleaned from 3,007 reports, articles and PowerPoints from the web and social media in a few seconds.
Summary
Drivers
- Training the best quality algorithms for the Air Force's drone swarms and teaming them with airmen will help the U.S. military maintain a competitive military advantage.
- The demand for an efficient anti-drone system is expected to rise in the coming years in the military and defense sector.
- Drone solutions are projected to replace $127 billion in industrial business services and labor costs in the not too distant future.
- With the world's largest logistics firms set to flood the market with cheap drones and delivery robotics in the next five years-Amazon and UPS to name just two huge investors-such trends are expected to accelerate.
- Drones could help save the insurance industry as much as $6.8 billion per year by reducing costs related to data collection, risk evaluation, and battling fraud.
Analysis
This summary analysis draws from our robot’s below visualizations of the future of drones and draws from different vantage points to tell the story of what’s emerging just like a GPS system.
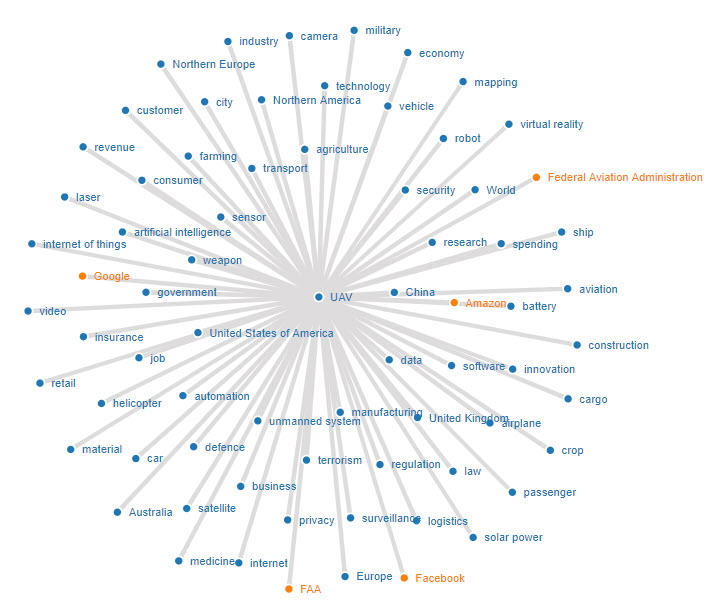
Systems map: Expect drone applications to proliferate into many aspects of life as the systems map shows.
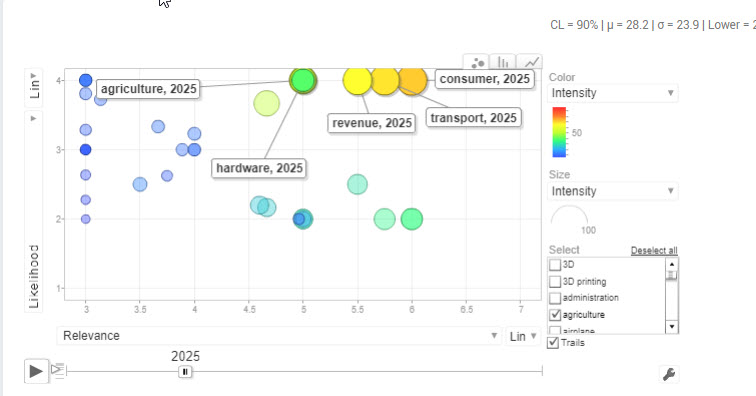
Radar chart: By 2025, the transportation sector is likely to be experiencing the biggest transformation with agriculture and hardware production earning huge revenues from consumers and industry alike.
Graph-It: Voice and AI will bring a massive shift in instore and ecommerce shopping habits with security and privacy at the forefront of sellers and buyers minds in 2021. Zero trust is on the rise.
Spline chart (Beta): Peak activity in terms of drone development is expected to peak around 2023 with a then tailing away of the phenomena to more business as usual.
Emerging Drivers:However, while the impact of drones will be very high, the tipping point for public acceptance is likely to lag due to concerns primarily about security to safety that will see much increased regulations and controls over use.
Sentiment: This is reflected in both sentiment charts below that indicate much higher levels of concern about the negative impacts of drones than any new technology we have covered over the years. Indeed, it’s the first time our robot identified more negative sentiments than positive. However, there are many positive sentiments towards drones particularly in dramatically improved delivery, inspection and subsequent cost reduction.
Pie Charts: The Pie Charts reflect that apart from increasing hobby drones we have yet to witness intense commercial use. 66% of efforts are still early stage while only ~10% can be considered ‘established to ‘growing’. But, the financial impact as roadblocks are overcome is substantial with most pundits suggesting a billions of dollars industry in just a decade.
Heat map: Most of the activity around drones is focused on transportation development, particularly in the United States, but most are still in weak signal or emerging mode.
Geography:Drone activity is likely to be concentrated first in America, Australia, China and the UK before expanding to other countries.
SWOT: Lastly, the SWOT chart shows predominant drone opportunities and strengths but also accompanying major threats and weaknesses that could raise real concerns about their ongoing use without strong controls.
Potential Solutions (New)
- Australia will introduce new surveillance technology for a crackdown on drones next year as concerns mount over their increasing prevalence in public areas.
- Some big news for 2019 could be workflow integration of drone data and workflow into predictive maintenance and service solutions, as well as enterprise asset management systems such as those from IBM, INFOR, Oracle and SAP.
- Thermal building inspection is critical for organizations as they look to reduce investment risk in the $750 billion combined commercial real estate, insurance, and management industry.
- Losses from Hurricane Irma have been predicted to reach $20 - to $40 billion and drones are being used to obtain greater insight into the damage and claims that resulted from that disaster.
- Delivering packages by a drone will be among main transportation market trends of 2018.
Potential Responses (New)
Determine how you can respond to Athena’s findings by examining your Options here either on your own publicly, or collaboratively if our private client.
Contact us if you would like some free training with this Options method.
Visuals
For more detailed explanation of the graphics below please click here. All outlooks based on 2025 unless otherwise stated.
System map
Expect drone applications to proliferate into many aspects of life as the systems map shows.
Radar chart
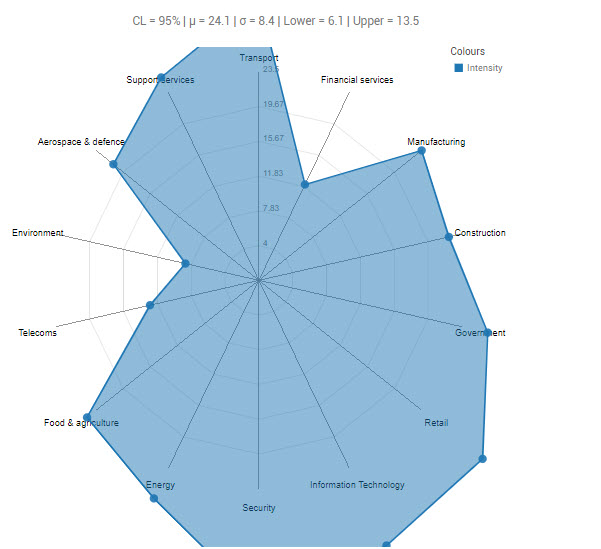
The future impact of drones is going to be off-the-chart for many sectors including Transport, Energy, IT, Support Services, Security, Retail and Government )both civil and military).
Graph-It
By 2025, the transportation sector is likely to be experiencing the biggest transformation with agriculture and hardware production earning huge revenues from consumers and industry alike.
Spline (Beta)
Peak activity in terms of drone development is expected to peak around 2023 with a then tailing away of the phenomena to more business as usual.
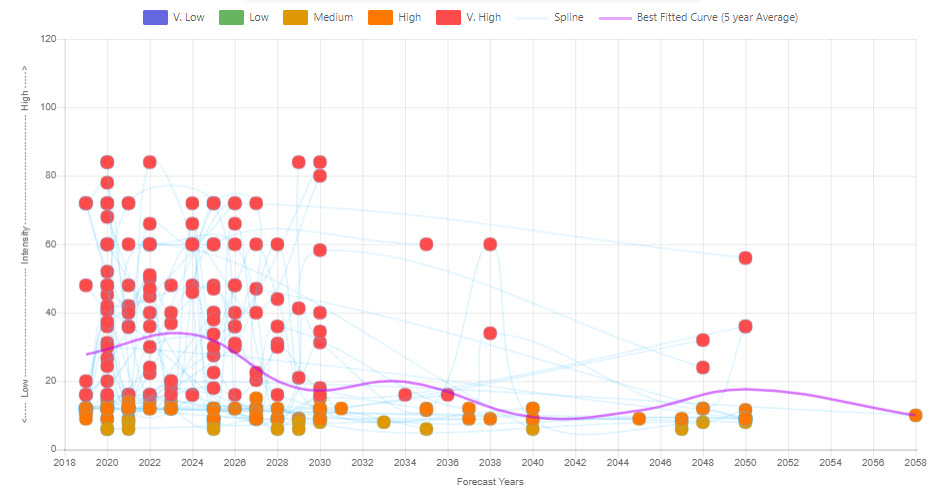
The blue line represents the five-year moving average of the aggregated splines that can be seen in background.
Emerging Drivers
However, while the impact of drones will be very high, the tipping point for public acceptance is likely to lag due to concerns primarily about security to safety that will see much increased regulations and controls over use.
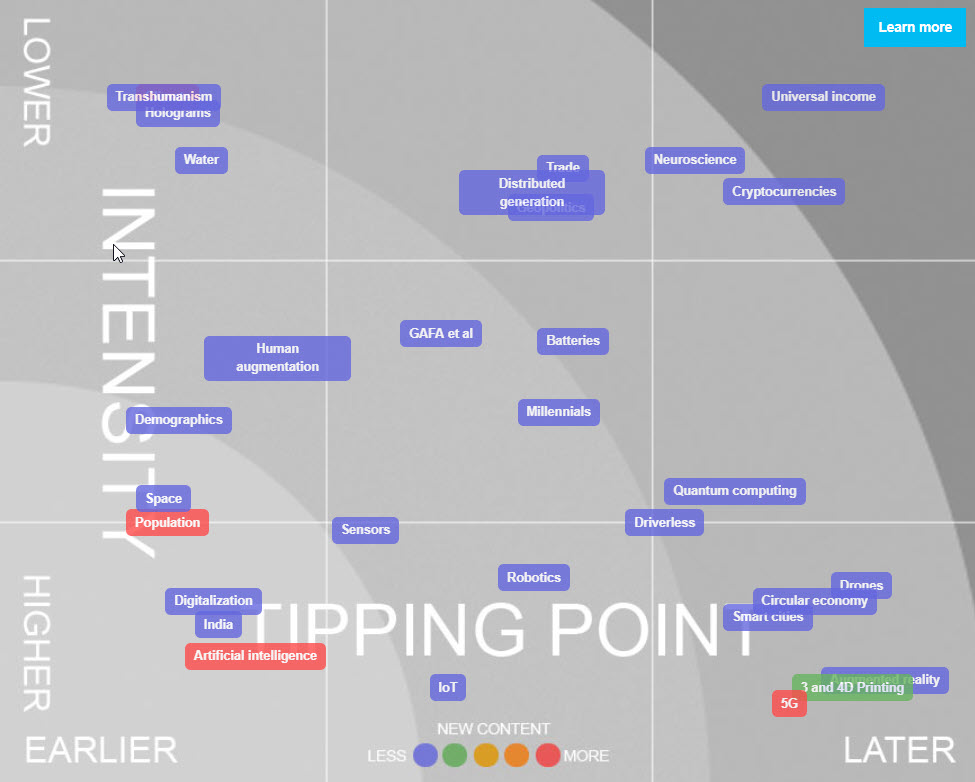
Sentiment
This is reflected in both sentiment charts below that indicate much higher levels of concern about the negative impacts of drones than any new technology we have covered over the years. Indeed, it’s the first time our robot identified more negative sentiments than positive.
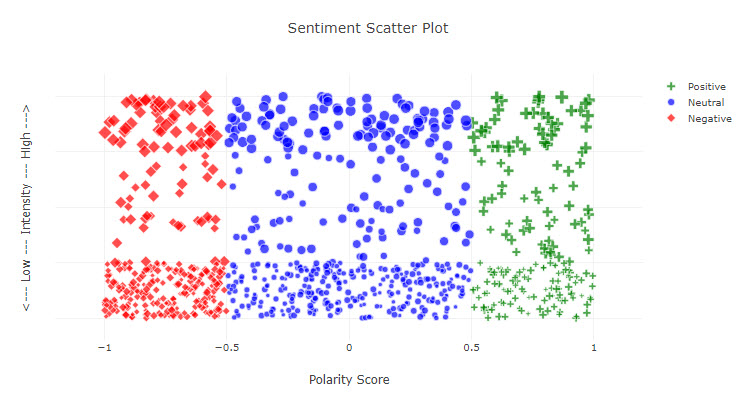
However, there are many positive sentiments towards drones particularly in dramatically improved delivery, inspection and subsequent cost reduction.

Pie Charts
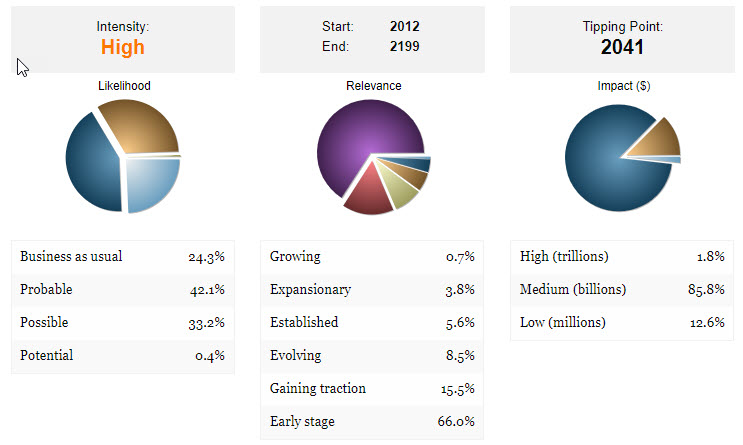
The Pie Charts reflect that apart from increasing hobby drones we have yet to witness intense commercial use. 66% of efforts are still early stage while only ~10% can be considered ‘established to ‘growing’. But, the financial impact as roadblocks are overcome is substantial with most pundits suggesting a billions of dollars industry in just a decade.
Heat map
Most of the activity around drones is focused on transportation development, particularly in the United States, but most are still in weak signal or emerging mode.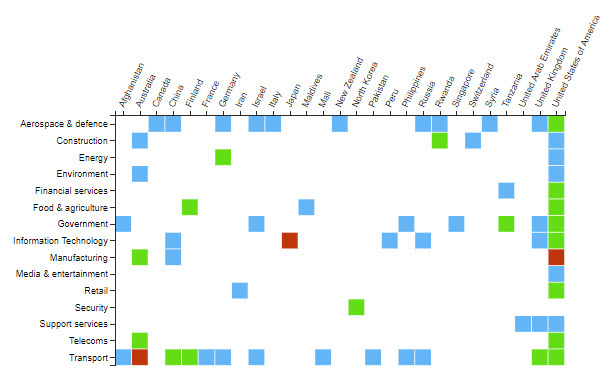

Geography
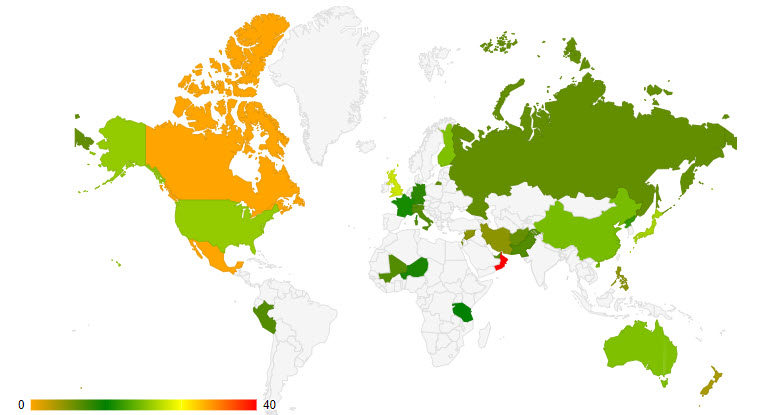
Drone activity is likely to be concentrated first in America, Australia, China and the UK before expanding to other countries.
SWOT
Lastly, the SWOT chart shows predominant drone opportunities and strengths but also accompanying major threats and weaknesses that could raise real concerns about their ongoing use without strong controls.

Evidence
Search term: “Drone*”
market
- Apart from saving souls, civilian drones are becoming a good business: The market will be worth $100bn by 2020 in areas such as surveying, security and delivery.
- The global drone propulsion system market research report by Technavio predicts the market to post a CAGR of close to 20% during the period 2018-2022.
- The consumer drone market will maintain a CAGR of 22.1% through 2020 with companies such as DJI, Parrot and 3D Robotics driving the market with a wide range of devices for photography, recreational use and racing.
- In Germany, nano drones have become extremely valuable tools for combat and surveillance activities in defense expected to drive the biomimetic nano drones’ market.
- From a financial standpoint, the market for recreational, commercial and government drones is expected to top the $12 billion mark by 2021.
- The UK aerial drone industry will contribute GBP42 billion and 628,000 jobs to the UK economy by 2030, while drones worldwide will be a USD100 billion (GBP78bn) market by 2020.
- The market for robots and drones will grow from $66 billion in 2018 to more than $210 billion in 2028.
- Increasing investment by public as well as private investors for the development of UAVs is going to drive the market for UAV in the coming years whereas safety concerns such as cyber-crime or permission to fly can act as a restraining factor in the market.
- Drones will play a part in the growth of the aerial imaging industry, as research expects the market to be worth nearly £3bn by 2024.
- The agriculture drone market will change the traditional farming processes in the coming years.
- The global drone data services and analytics market is expected to witness significant growth over the forecast period 2018-2023, due to the rising demand across various industries including agriculture, construction, and utilities, among others.
- The consumer and commercial drone markets have been growing rapidly and are expected to reach a combined US$30 billion by 2020.
- The commercial drone market could become a $127 billion industry by 2020.
drone
- A drone has been used for the first time to collect whale mucus from humpback whales at sea in a technique that could help monitor the health of whales around the world.
- Consumers are still waiting for drones to deliver Amazon packages, as CEO Jeff Bezos in 2013 predicted would occur within five years.
- What could have eventually developed into a serious pothole is fixed instantly and the drone flies off to search for its next assignment.
- As drones proliferate, local security managers in the UK will be united with base commanders of Iraq and Afghanistan in one key aspect - they will be failing to manage one of the key security risks of the 21st century.
- Many companies will be showing off drones that can capture footage underwater.
- Analyst firm IDC expects spending on robotics systems and drones to total $115.7 billion next year, a 17.6 percent increase from 2018.
- Drones will change the face of agriculture, it will change the entire predictability in the agriculture sector.
- The drone industry will be worth £42 billion to the UK by 2030 with over 76,000 drones in use, with a third by public sector.
- By 2022, the size of the robotics market - robots, drones, and all related technology and services - will total $210 billion.
- On drones in 2019: Drones will continue to pop up in amazing new applications in 2019, with ever greater sensor capabilities and advances in pilot-guided automation.
- Some predict 2019 will be the year the FAA implements a requirement for remote identification for all drones, recreational and commercial, flying in the U.S.
- Total drone sales are expected to reach 3.4 million units (four percent increase) and just over $1 billion in revenue (four percent growth) in 2019, as more consumers and businesses adopt drones for aerial photography, drone racing and recreation.
- Whilst the UK is not alone in procrastinating on how to handle the proliferation of drones - new research forecasts the drone market will be worth about US$ 8,240.2 million by 2026 - other nations around the world appear to be more pro-active.
- MEMS motion sensors in drones and toy helicopters is expected to reach in total approximately 70 million units until 2021, with a CAGR 2018-2021 of 17%.
- Australia will introduce new surveillance technology for a crackdown on drones next year as concerns mount over their increasing prevalence in public areas.
- Around 76,000 drones are expected to be in British skies by 2030, creating some 628,000 jobs.
- The range of programmes under Defence Innovations in the coming year will concentrate on drones, digital communications for commando operations and virtual reality training.
federal aviation administration
- With further regulatory changes expected from the Federal Aviation Administration (FAA) in 2019, the drone industry is set for another year of extraordinary growth.
- The Federal Aviation Administration expects the number of drones flying for business purposes to skyrocket to more than 450,000 drones by 2022.
- The Federal Aviation Administration (FAA) believes that by 2022 there will be over 700,000 drones delivering packages, monitoring traffic and aiding in search and rescue operations.
- More than 110,000 commercial small drones are registered with the Federal Aviation Administration (FAA), and it expects over 450,000 commercial drones to be flying by 2022.
- The Federal Aviation Administration predicts a fourfold increase in commercial drones by 2022.
- Earlier this year the city of Louisville in Kentucky submitted an application to the Federal Aviation Administration asking if it could use drones to respond to shooting scenes.
- The drone industry is in the midst of a boom, with the Federal Aviation Administration expecting the total commercial hobbyist fleet to reach 422,000 by 2021 after only 108,000 in 2017.
industry
- The professional drone market will manage a compound annual growth rate of 77.1% through 2020 driven by industries such as agriculture, energy and construction using the technology for surveying, mapping, planning and more.
- Industry spending on drones in 2019 will be led by utilities ($1.4 billion), construction ($1.05 billion) and discrete manufacturing ($913 million).
- Convoys of the self-driving drone lorries are expected to be trialled on the nation’s roads next year, with the M5 between Plymouth and Birmingham seen as one of the safest to introduce the new tech, which could have major ramifications to the industry as well as road safety.
- The global commercial UAV market will exceed $17 billion by 2024, creating adjacent industries related to drone safety.
- Drones will play a part in the growth of the aerial imaging industry, as research expects the market to be worth nearly £3bn by 2024.
- With further regulatory changes expected from the Federal Aviation Administration (FAA) in 2019, the drone industry is set for another year of extraordinary growth.
- The drone industry will be worth £42 billion to the UK by 2030 with over 76,000 drones in use, with a third by public sector.
- The drone industry is in the midst of a boom, with the Federal Aviation Administration expecting the total commercial hobbyist fleet to reach 422,000 by 2021 after only 108,000 in 2017.
association
- The Association for Unmanned Vehicle Systems International estimates the drone market will continue to grow in the next decade, with annual direct spending on UAS development to reach $5 billion by 2025.
- The Consumer Technology Association predicts some 1.5 million drones will be sold during the final three months of the year, an increase of 8 percent over 2017.
- A study from the Consumer Technology Association estimated that 3.7 million personal drones are expected to be sold in 2018, a 20 percent increase over the previous years.
technology
- The professional drone market will manage a compound annual growth rate of 77.1% through 2020 driven by industries such as agriculture, energy and construction using the technology for surveying, mapping, planning and more.
- Researchers at Queensland University of Technology, Australia have announced that the RangerBot has a new mission: it is to be rechristened LarvalBot and will be repurposed to spread coral babies.
- Drones 2018-2038: Components, Technologies, Roadmaps, Market Forecasts sees a plausible scenario in which the drone market will reach some $33.5Bn by 2028, up from around $4.5Bn in 2017/18.
- The relatively cheap technologies for mass monitoring of individual plants across large greenhouses or crop fields could get field tests in three countries starting in 2019.
- Businesses and civil governments sectors will have spent $13 billion on commercial drone technology between 2016 and 2020.
- A recent report by PwC - Skies without limits - puts the value of drone technology to the UK's wider construction and manufacturing sector at up to £3.5bn and forecasts by 2030 there will be more than 76,000 operator-controlled drones in regular use.
system
- With central big data systems synced to mobile edge computing drones, AI-powered orchestration between vehicles will be able to handle ever shorter and shorter delivery times and even complex instructions.
- The demand for an efficient anti-drone system is expected to rise in the coming years in the military and defense sector.
- Some big news for 2019 could be workflow integration of drone data and workflow into predictive maintenance and service solutions, as well as enterprise asset management systems such as those from IBM, INFOR, Oracle and SAP.
- This year, the FAA will enact regulations that will bring us closer to a unified, connected, global system of manned and unmanned vehicles.
- By 2030, U.S. missile defence architecture might be strengthened by prototypes of new space systems, defences against hypersonic weapons, and drones with lasers to intercept missiles in their boost phase.
- Analyst firm IDC expects spending on robotics systems and drones to total $115.7 billion next year, a 17.6 percent increase from 2018.
- In the drone space, spending will be $12.3 billion next year, but the growth rate (30.6% CAGR) will be higher than robotics systems (18.9% CAGR).
- The U.S. will spend $17.2 billion on robotics systems and drones, with $4.8 billion spent on drones, IDC said.
- Following China, the rest of Asia-Pacific (except Japan) will spend $23.3 billion on drones and robotics systems, and Western Europe will spend $13 billion in 2019.
rate
- Worldwide spending on robotics, drones and related hardware, software and services will grow from $103 billion in 2018 to $218 billion in 2021 at a compound annual growth rate of 25.4%.
- The professional drone market will manage a compound annual growth rate of 77.1% through 2020 driven by industries such as agriculture, energy and construction using the technology for surveying, mapping, planning and more.
- Investments in drones will total $12.3 billion in 2019 but are forecast to grow at a faster rate (30.6% CAGR) than robotics systems (18.9% CAGR).
- In the drone space, spending will be $12.3 billion next year, but the growth rate (30.6% CAGR) will be higher than robotics systems (18.9% CAGR).
- Broadband IoT will be commercially available in 2019, and it will be further enhanced by 5G, which will provide even higher data rates and lower latency.
- Services market is expected to have the highest growth rate during the forecast period 2018-2023.
use
- EU Member states such as France are involved in UN or other military operations to combat armed groups and terrorists, which soon will see the use of armed drones.
- Drones are projected to be $100 billion market, with $70 billion for military uses, $17 billion for consumer products and $13 billion for commercial and civil uses.
- Drone operations Beyond Visual Line of Site will experience increased FAA waivers in specialized use cases leading the way for the potential in future years for drone delivery and industrial use in long corridor applications.
- First developed for military use during World War One, drones are now a global industry that investment bank Goldman Sachs expects to be worth $100bn (£79bn) by 2020.
- Total drone sales are expected to reach just over $1 billion in revenue this year as more consumers and businesses turn to drones for aerial photographing, racing, and recreational uses.
- The consumer drone market will maintain a CAGR of 22.1% through 2020 with companies such as DJI, Parrot and 3D Robotics driving the market with a wide range of devices for photography, recreational use and racing.
- A recent report by PwC - Skies without limits - puts the value of drone technology to the UK's wider construction and manufacturing sector at up to £3.5bn and forecasts by 2030 there will be more than 76,000 operator-controlled drones in regular use.
sale
- Small hobbyist drones will more than triple in sales to 3.5 million units by 2021 (an increase from 1.1 million drones in 2016).
- Some estimates predict $12 billion in drone sales by 2021.
- Consumer drones are one of the fastest growing products, with total sales expected to reach over $1 billion this year.
- The latest CTA Consumer Technology Sales and Forecasts Report shows consumer drones are one of the fastest growing product categories for the U.S. tech industry with total sales expected to reach over $1 billion in revenue this year.
- Total drone sales are expected to reach just over $1 billion in revenue this year as more consumers and businesses turn to drones for aerial photographing, racing, and recreational uses.
-
Forecast: